New paper by Apoorva
Apoorva Shastry has just had a paper accepted in Frontiers. Describing it, she writes:
According to the World Disasters Report, over 59,000 people were killed with 865 million people directly affected by floods between 2005 and 2014. The economic damages caused by these floods was over 340 billion US dollars. With growing population exposure and climate change, the number of people that are exposed to flood risks, and the frequency and magnitude of floods maybe expected to increase. There is a need for better flood forecasting, and flood inundation models play an important role here. Flood models use topographic data along with other information to predict spatial extents of floods. Quality of topographic data (generally used in the form of digital elevation models, DEMs) is paramount for flood models. Vertical inaccuracies in freely available global DEMs (like SRTM) lead to spatial inconsistencies in predicted flood extents.
In this paper, we propose a new method to infer floodplain topography using remotely sensed flood maps through data assimilation. Satellite derived flood maps provide auxiliary information about ground elevations along the flood boundary. We merge observed flood maps along with flood maps from the model output to estimate the DEM using a particle batch smoother. The synthetic implementation of this algorithm shows that we can significantly reduce bias and standard deviation of errors in the DEM, and use this to better predict flood extents. The algorithm produces promising results, and this type of analysis can be performed in data-poor floodplains where high resolution DEMs do not exist.
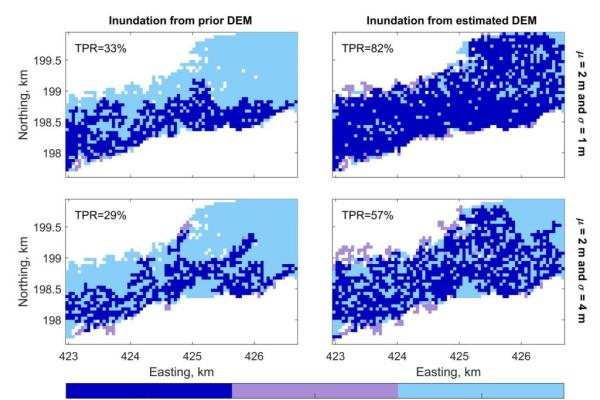
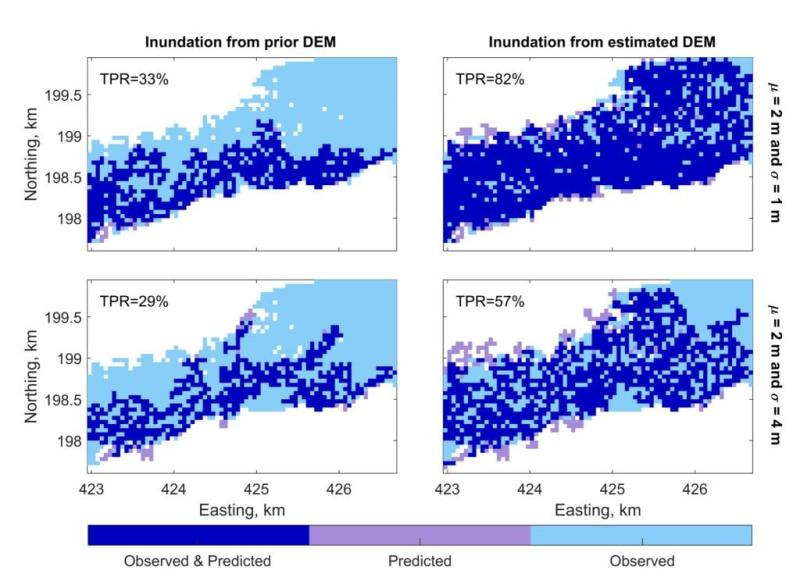
This graphic illustrates Apoorva’s analysis: numerical simulations using synthetic observations to demonstrate algorithm feasibility. The panels on the left show typical flood inundation skill from existing DEMs: dark blue shows areas successfully predicted by flood models. Panels on the right show improved skill after incorporating flood extent observations. The “true positive rate” (TPR) is significantly improved by the algorithms.
Studies using real observations are underway.