Jakobshavn
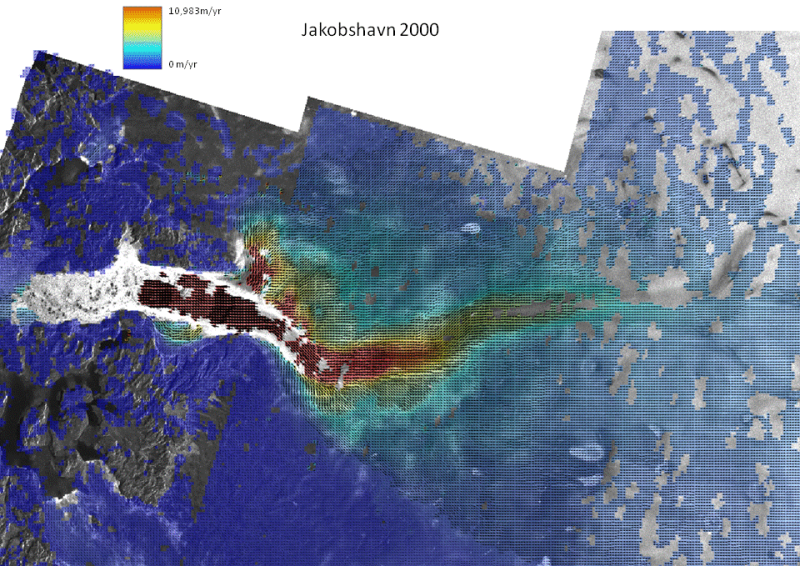
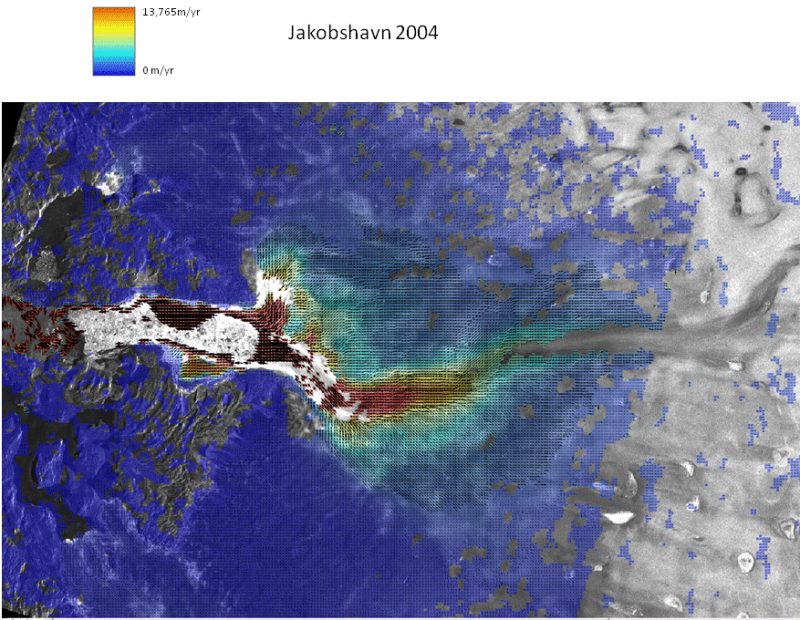
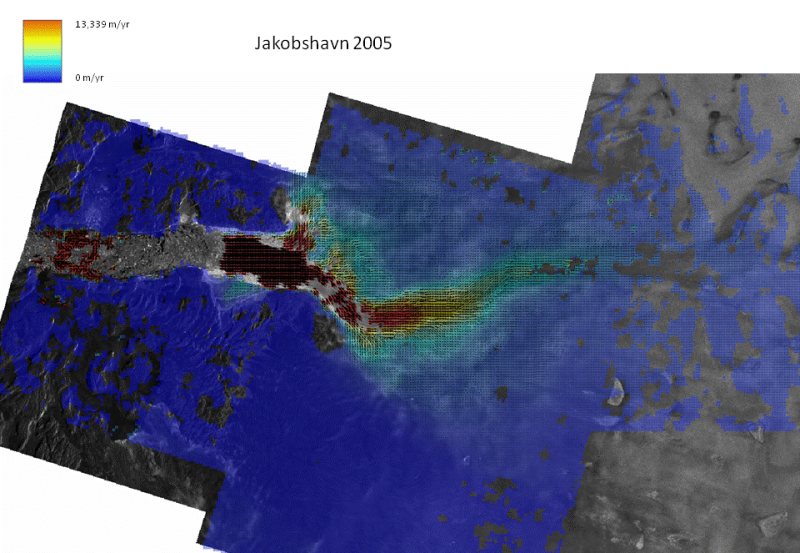
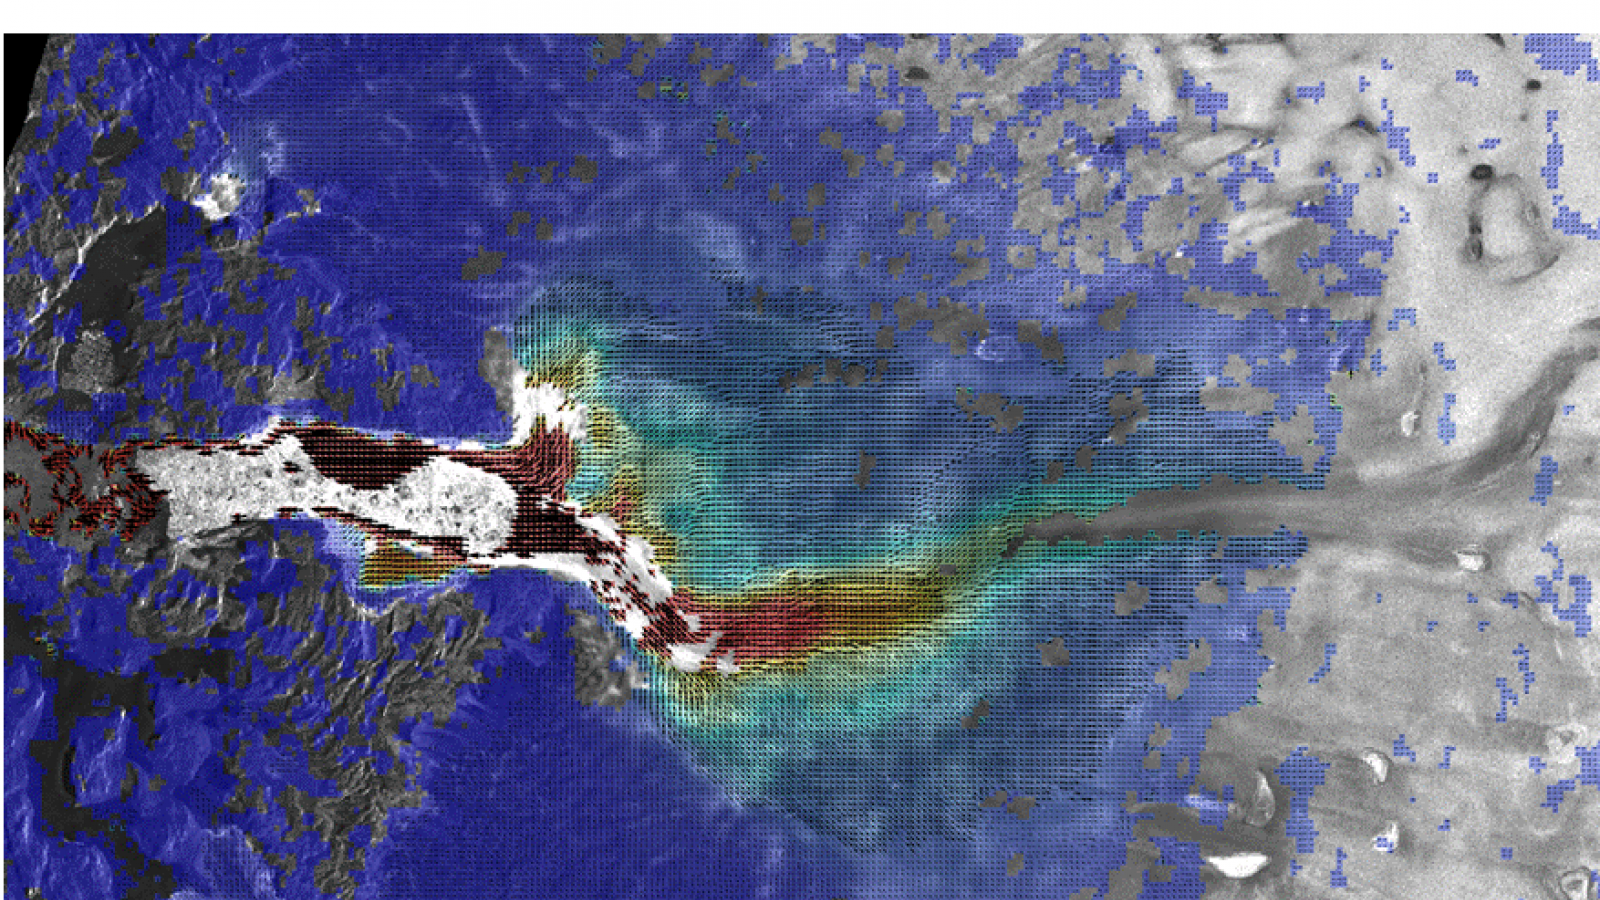
Jakobshavn Glacier, Greenland: 2000, 2004, 2005, 2006, and 2008 Velocities
Jakobshavn Glacier, Greenland's largest glacier, drains approximately 6.5% of the ice sheet and is a key factor in the mass balance of the Greenland Ice Sheet. Although the interior of the ice sheet is in a state of balance, the coastal region has continued to thin. While there has been variability in the velocity of Jakobshavn over time the ice front has steadily retreated. It wasn't until the year 2000 that an increase in ice flow velocities was recorded and an increasing trend observed.
Interferometric pairs are used to compute ice sheet surface velocities for the years 2000, 2004, 2005, 2006 and 2008 during the approximate months of November through January of the following year. The methodology and results discussed in this report are provided in partial fulfillment of OSU's agreement to provide remote sensing data to the Center for Remote Sensing of Ice Sheets (CReSIS) CReSIS Home Page science requirements. CReSIS's vision is to advance understanding of polar ice sheets sufficiently for the development of models that reliably predict future ice sheet contributions to sea level rise under prescribed changes in climate.
This site contains the following data products:
- Documentation and procedures used to process the RADARSAT data pair
- Velocity ASCII files containing the final derived velocities
- SAR mosaics (100m) of the area studied in binary, geotif, and ERDAS Imagine formats
- RAMS Final Velocity Products (the individual pieces that went into making the derived ASCII version)
Velocity ASCII Files
- 2000 Jakobshavn Velocities (X, Y, mag, vx, vy, angles)
- 2004 Jakobshavn Velocities (X, Y, mag, vx, vy, angles)
- 2005 Jakobshavn Velocities (X, Y, mag, vx, vy, angles)
- 2006 Jakobshavn Velocities (X, Y, mag, vx, vy, angles)
- 2008 Jakobshavn Velocities (X, Y, mag, vx, vy, angles)
Corresponding SAR Mosaics
SAR Mosaics 16-bin binary and header file
- 2000 Jakobshavn Mosaic 100m
- 2000 Jakobshavn header file
- 2004 Jakobshavn Mosaic 100m
- 2004 Jakobshavn header file
- 2005 Jakobshavn Mosaic 100m
- 2005 Jakobshavn header file
- 2006 Jakobshavn Mosaic 100m
- 2006 Jakobshavn header file
- 2008 Jakobshavn Mosaic 100m
- 2008 Jakobshavn header file
SAR Mosaics GeoTiff and header file
- 2000 Jakobshavn Mosaic 100m
- 2000 Jakobshavn header file
- 2004 Jakobshavn Mosaic 100m
- 2004 Jakobshavn header file
- 2005 Jakobshavn Mosaic 100m
- 2005 Jakobshavn header file
- 2006 Jakobshavn Mosaic 100m
- 2006 Jakobshavn header file
- 2008 Jakobshavn Mosaic 100m
- 2008 Jakobshavn header file
SAR Mosaics ERDAS Imagine format (with rrd file)
- 2000 Jakobshavn Mosaic 100m
- 2000 Jakobshavn rrd file
- 2004 Jakobshavn Mosaic 100m
- 2004 Jakobshavn rrd file
- 2005 Jakobshavn Mosaic 100m
- 2005 Jakobshavn rrd file
- 2006 Jakobshavn Mosaic 100m
- 2006 Jakobshavn rrd file
- 2008 Jakobshavn Mosaic 100m
- 2008 Jakobshavn rrd file
RAMS Final Velocity Product Documents
In order to capture the diverse velocity field of the Jakobshavn Glacier Basin multiple sets of RAMS Vphase parameters had to be used, resulting in multiple sets of overviews (ov_## files listed below). A detailed description of all the RAMS VphaseTool Phase I parameters (registration and creation of interferograms) was provided by the Vexcel Corporation, the developers of RAMS, and is available in addendum III of the BPRC Tech Report.
In the creation of the interferograms, the three prominent parameters used for estimating a range of velocities are the 1) lower coherence threshold, 2) offset chip size and 3) offset search radius, all other default parameters were used. A description of the 'optimum' search radius and chip sizes is included below ('Optimal Search Radius and Chip Size' link).
Readme file associated with each *.tar file. Please read to familiarize yourself with the contents of each file.
RAMS Final Velocity Product Year 2000

RAMS Final Velocity Product Year 2004

RAMS Final Velocity Product Year 2005


