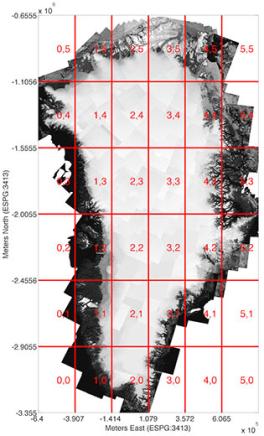
Greenland Ice Mapping Project (GIMP) Ice and Ocean Mask

Description
A raster binary land classification mask with 1 for glacier ice and 0 for all other terrain or water. Ice cover was mapped from a combination of orthorectified Landsat 7 panchromatic band imagery, distributed by the United States Geological Survey (USGS), and RADARSAT-1 Synthetic Amplitude Radar (SAR) amplitude images produced by I. Joughin at the Applied Physics Laboratory, Univ. of Washington. Landsat imagery was from the months of July through September in 1999, 2000 and 2001 (mostly 2000). RADARSAT images were from fall of 2000. The 15-m data are subdivided into 36 tiles, shown in the image to the left. Each tile zipfile contains the byte image mask and an ascii header (ENVI format) giving size, map and format information. Additionally, 90 m and 180 m-resolution binned mosaics of the data are also provided. In these, each pixel value is the number of 15-m pixels flagged as ice within that that pixel. For example, in the 180 m mosaic, no ice would be 0, all ice would be 144 (180/15)^2 and a value of 72 would indicate that 50% of that pixel is ice covered.
Data now available from the NSIDC
Data Citation
Howat, I.M., A. Negrete, B.E. Smith, 2014, The Greenland Ice Mapping Project (GIMP) land classification and surface elevation datasets, The Cryosphere, 8, 1509-1518, doi:10.5194/tc-8-1509-2014 abstract | article [pdf]
[pdf] - Some links on this page are to Adobe .pdf files requiring the use of Adobe Reader. If you need these files in a more accessible format, please contact howat.4@osu.edu.
