The City of Columbus Releases Results of its Urban Heat Mapping
This past summer, Geddy Davis, program coordinator, weather and climate services, and Karina Peggau, education and outreach program coordinator at the Byrd Polar and Climate Research Center at The Ohio State University, participated in a project to map Columbus' urban heat islands. They were part of a large group of volunteers with the City of Columbus' Sustainable Columbus program, driving through the city neighborhoods to collect climate data using sensors mounted on their cars. The volunteers were part of a community-led effort to map urban heat islands, working with the National Oceanic and Atmospheric Administration's (NOAA's) national campaign.
Heat islands are urban areas with greater densities of pavement and buildings and less tree cover and are typically two to six degrees warmer than their surrounding rural areas.
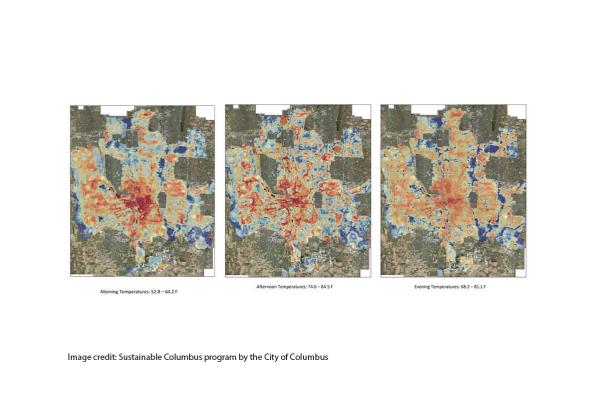
The city of Columbus recently released the results of this campaign revealing temperatures can vary by up to 13 degrees at the same time of day in different neighborhoods. While some areas experienced increased heat during the day, evening mapping data revealed a maximum 13.2-degree differential.
This campaign's results will help implement strategies and environmental policies aligned with the Columbus Climate Action Plan.
The City of Columbus, along with community stakeholders and the public, created a Climate Action Plan that includes an emissions reduction of 45% by 2030 to meet the 2050 carbon neutrality goal of Mayor Andrew Ginther.
Read more about the Columbus Area Heat map results through the Sustainable Columbus portal.
The Image to the right is of three Columbus Heat Map Rasters, morning, afternoon and evening- Image credit: Sustainable Columbus program by the City of Columbus.