SWOT Satellite Delivers First Global Estimates of River Discharge

A study led by an international team of researchers published in Geophysical Research Letters reports the first global estimates of river discharge, the volume of water flowing past a point per unit time, derived from the Surface Water and Ocean Topography (SWOT) satellite by addressing gaps where ground-based gauges that measure water levels in rivers and streams at specific locations are sparse or absent. This research demonstrates that satellite observations could substantially extend our understanding of river flow in hard-to-monitor regions.
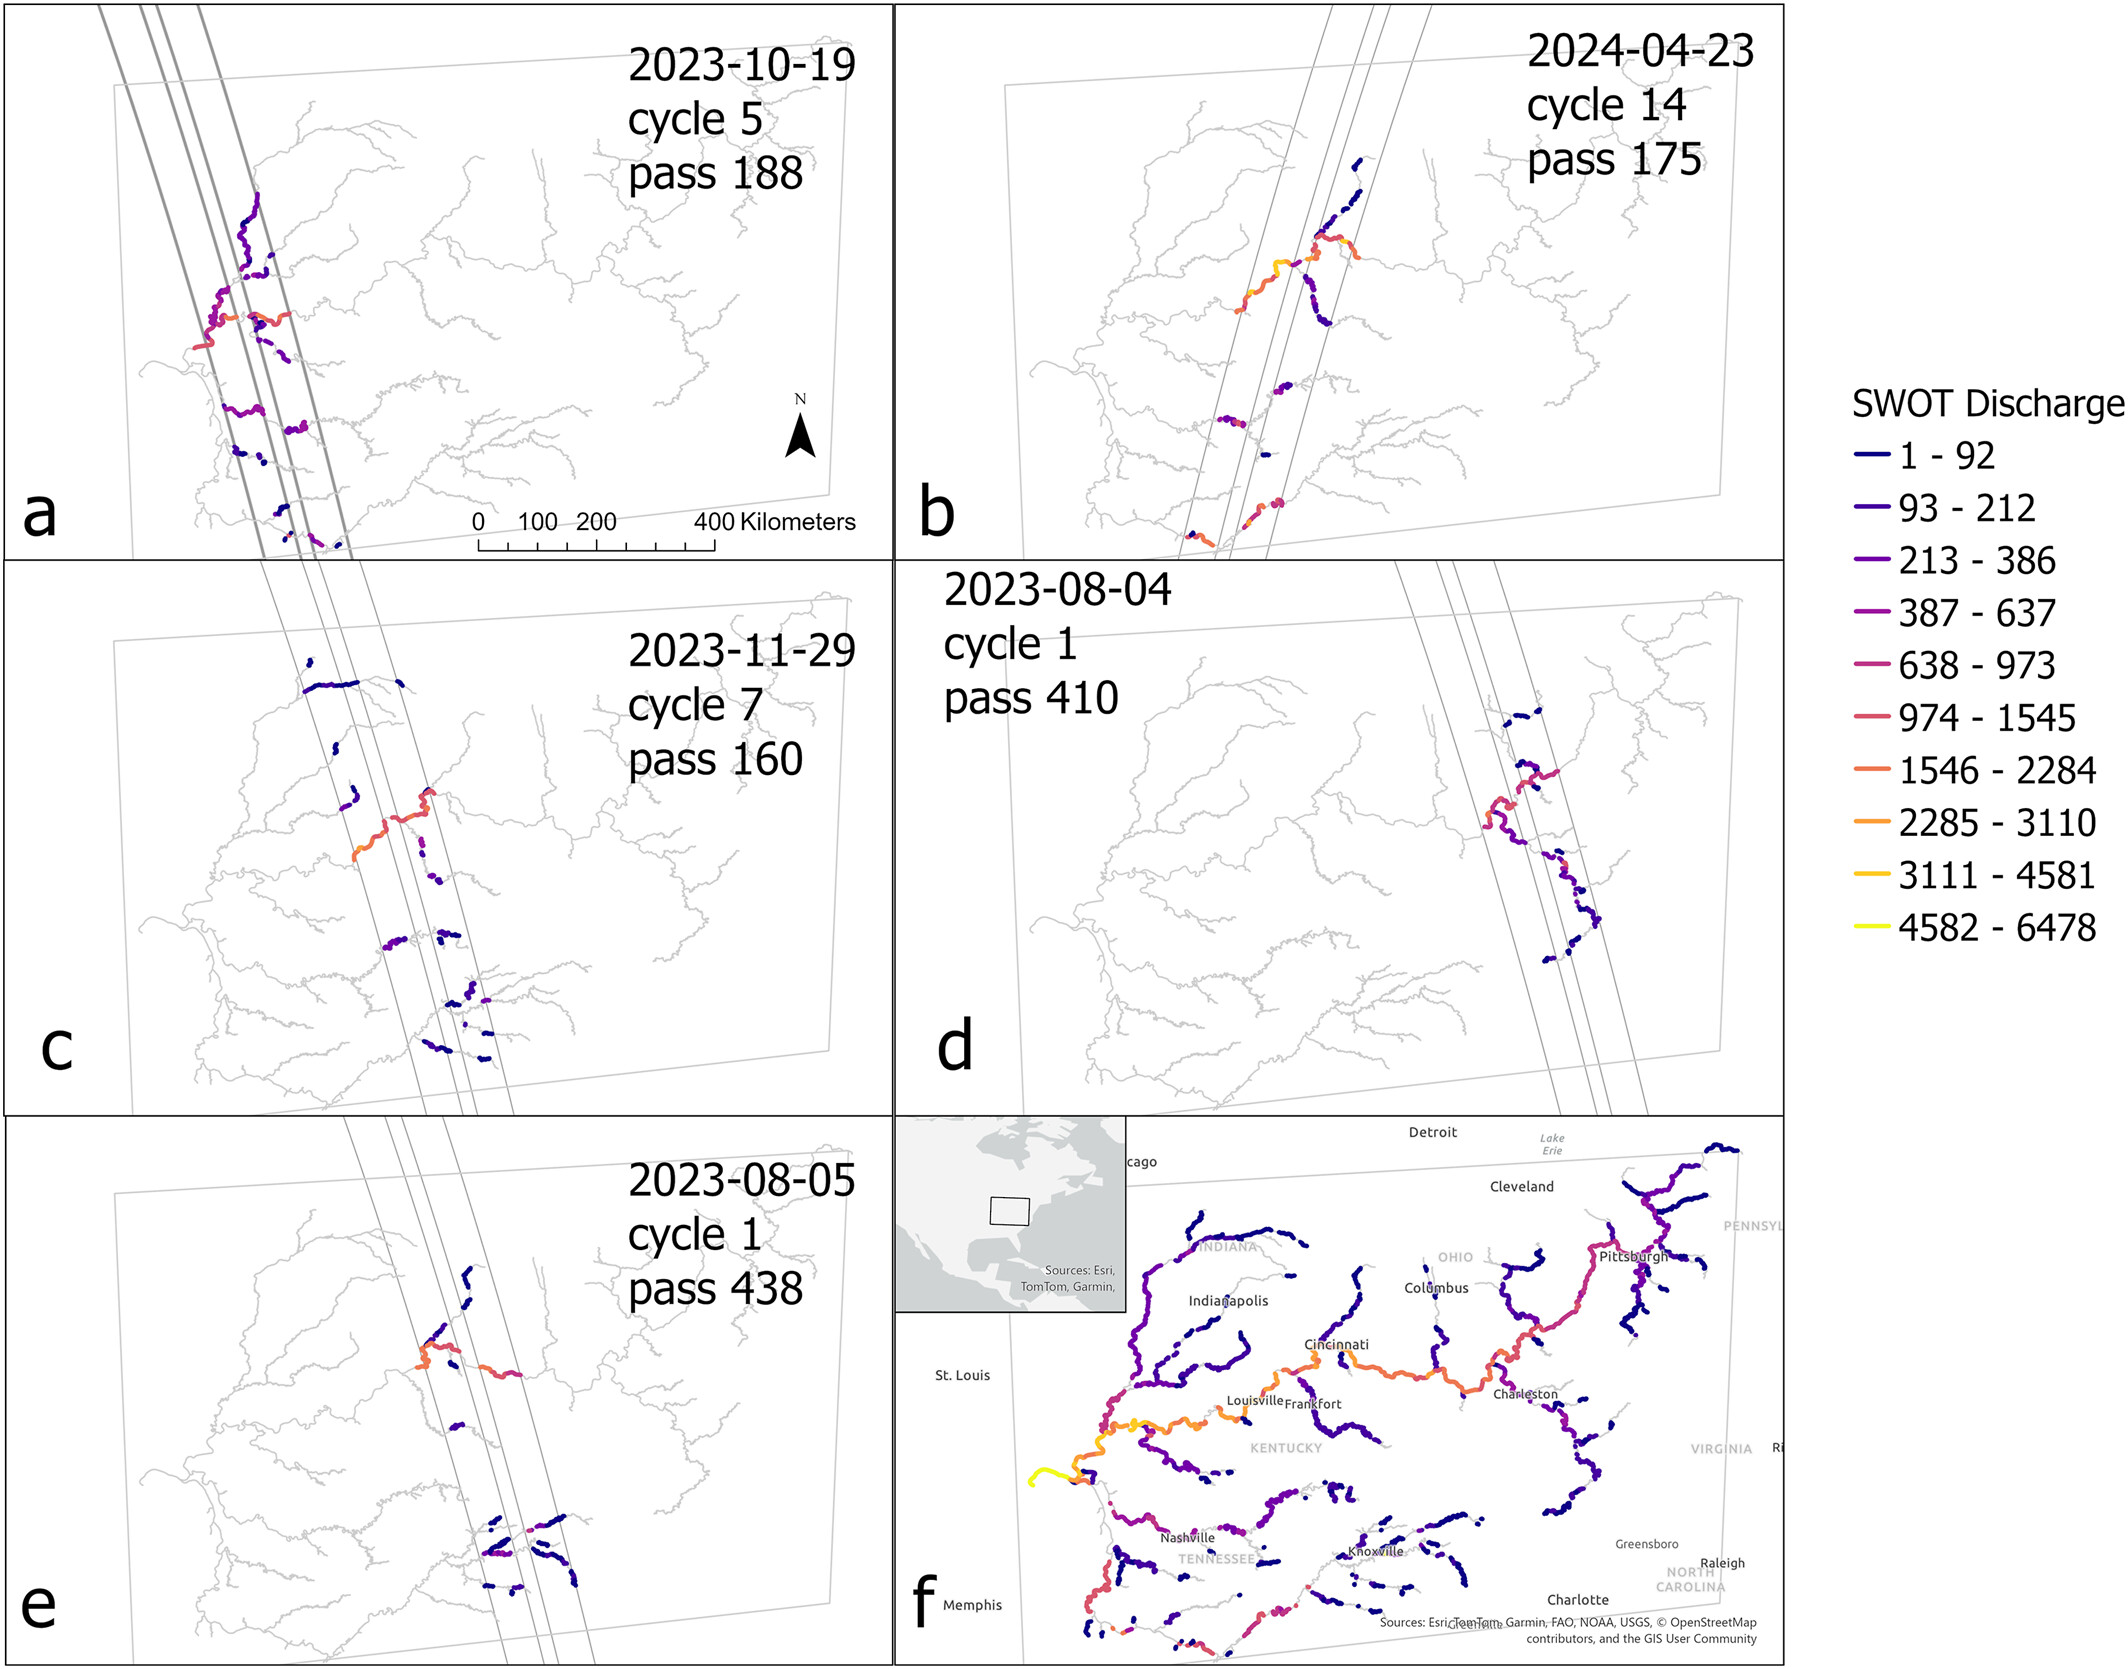
By evaluating discharge estimates derived solely from SWOT observations and using the first 15 months of SWOT data (March 2023–July 2024), the team assessed 65 gauged river reaches (∼10-km segments) worldwide. SWOT simultaneously observed water-surface elevation, river width, and slope to estimate discharge without relying on ground-based inputs, then compared those estimates to gauge records—the satellite captured discharge timing and variability, with a median Spearman correlation of 0.73. Performance was strongest on large rivers (e.g., the Mississippi), while some smaller rivers showed bias—for instance, magnitudes were overestimated on France’s Loire. Across sites, the median bias was approximately 50%, primarily attributed to inaccuracies in the prior flow estimates used by the algorithms. Accuracy is expected to improve as algorithms evolve and the record lengthens, and SWOT already delivers estimates for over 11,000 ungauged sites.
Among the study’s co-authors are three researchers from The Ohio State University’s Byrd Polar and Climate Research Center. Steve Coss, a Research Scientist, contributed to evaluating data quality and model performance. Professor Michael Durand from the School of Earth Sciences serves as the principal investigator at the Byrd Center’s Water Cycle research group, as well as the Center’s Interim Director. Research Associate Bidhyananda Yadav contributed to the data quality assessment and model performance. All are members of the Discharge Algorithms Working Group (DAWG), which converts SWOT observables into discharge estimates and is developing and validating the associated data products. The research confirms that SWOT complements, rather than replaces, stream gauges; it could substantially extend monitoring to remote or politically inaccessible watersheds, informing water management, climate modeling, and ecological assessments. Read more about the study.
Related News:
- River Discharge from the SWOT Mission: Source CNES, NASA/JPL/PO.DAAC Published: March 13, 2025
- Resources: NASA Caltech JPL Media
- Bridging the Gaps in Global Water Monitoring: Groundbreaking SWOT Mission Insights Revealed at AGU Annual Meeting
- Revolutionizing River Research: How the SWOT Mission is Transforming Global Hydrology
- The Surface Water and Ocean Topography Satellite: a Game-Changer in Measuring River Basins Worldwide, from the Familiar to the Uncharted
- The Surface Water and Ocean Topography Satellite to Collect Data on Over 90% of the Water on Earth's Surface
- NASA and Google's Collaborative Venture: 'A Passage of Water' - An Interactive Dive into Global Freshwater Resources