
Visit "Increasing risk of glacial lake outburst flood in Sikkim, Eastern Himalaya under climate warming," to learn more about this study.
Image Descriptions:
- Top row- Left to right:
- A large map with a stream network with three inserts in a column to the right of the big map generated over the Sikkim Himalaya.
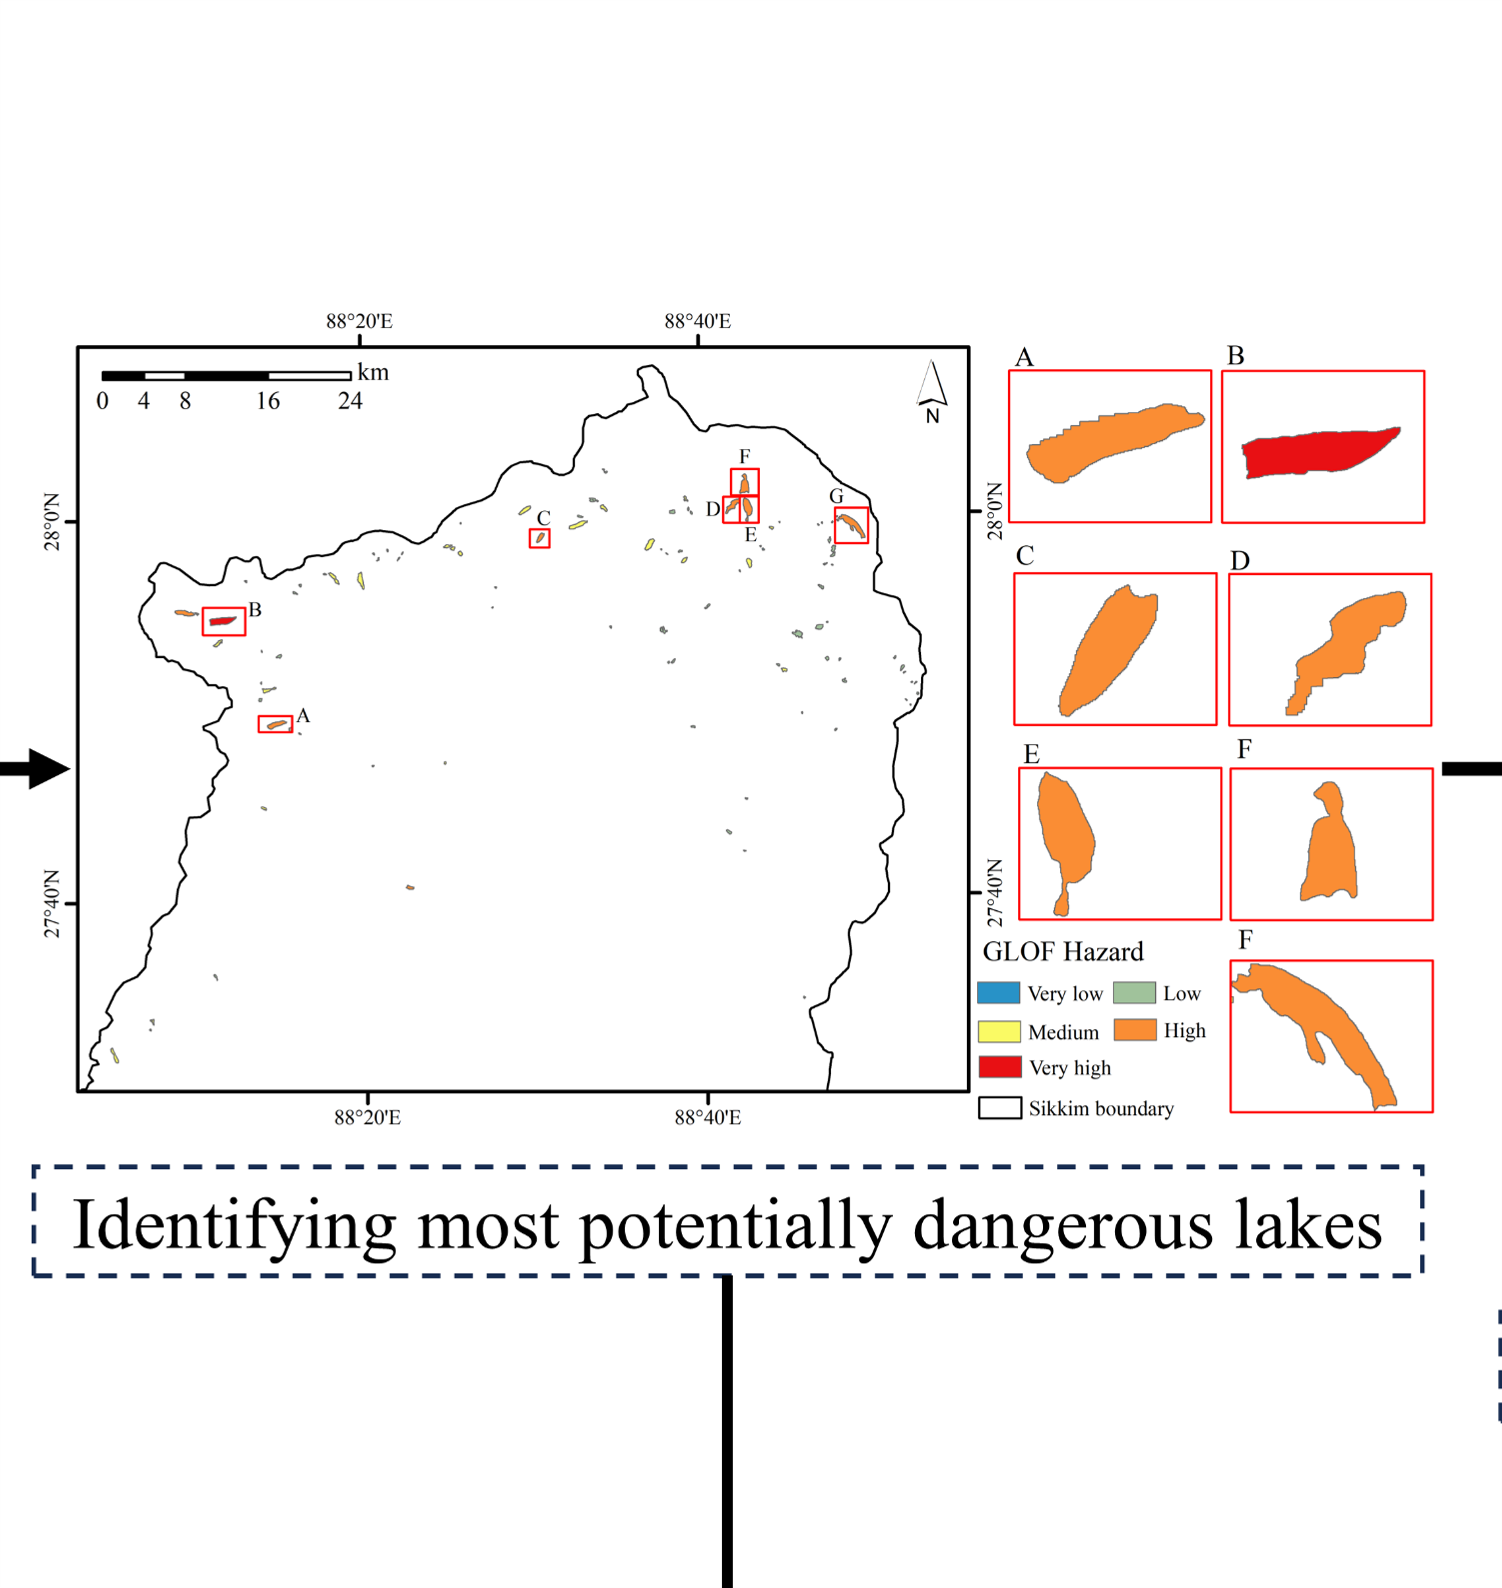
- A large map of Sikkim Himalaya with eight inserts maps of glacial lakes in two columns and four rows on the right.
- Four hydrographs in two columns show Sikkim's most dangerous glacial lakes exhibiting peak discharges for two scenarios.
- Bottom row- Left to right:
- The long-term mass loss trend over the Sikkim Himalaya (linear trend and inter-annual variability) during April 2002–May 2023.
- Long-term variability (total precipitation, mean maximum temperature, and mean minimum temperature) in climate data was observed at Gangtok Automatic Weather Station on an Annual and seasonal scale from 1990 to 2017.