Scientists Map Earth’s Most Remote Regions
body{ min-width: unset; overflow-x: hidden; } #zone-content { width: 100%; } #region-sidebar { display: none; } .breadcrumb-wrapper { display: flex; background-color: #666666; } body.html .breadcrumb-left{ margin-left: auto; margin-right: auto; } #breadcrumb-right-wrapper { display: none; } #page-title { display: none; } footer.submitted { display: none; } .field-name-field-news-image { display: none; } #region-content { width: 100%; } #block-system-main p { max-width: 720px; margin-left: auto; margin-right: auto; padding-left: 15px; padding-right: 15px; font-size: 1.2rem; line-height: 1.45; } #block-system-main figure { max-width: 720px; margin: auto; margin-bottom: 2rem; } #region-content { margin: 0; } #region-content > div { padding-top: 0; } #news-header { background: linear-gradient( rgba(0, 0, 0, 0.5), rgba(0, 0, 0, 0.5) ), url(http://polarmet.bpcrc.osu.edu/sites/polarmet/files/images/NASA.jpg); background-size: cover; height: 300px; background-repeat: no-repeat; background-position: center top 30%; color: white; } #node-asc-news-1096 > div.content.clearfix > div.field.field-name-body.field-type-text-with-summary.field-label-hidden > div > div > figure.two-images > img:nth-child(1),#node-asc-news-1096 > div.content.clearfix > div.field.field-name-body.field-type-text-with-summary.field-label-hidden > div > div > figure.two-images > img:nth-child(2) { margin-left:1%; margin-right:1%; max-width:47.5%; height:auto; } #news-header h1, #news-header h2 { color:white; text-shadow: 1px 1px 1px rgba(0,0,0,.8); color: white; display: block; width: 80%; margin: auto; text-align: center; } #news-header h1 { font-size: 2rem; padding-top: 3.5rem; } div.vimeo-wrapper { max-width:720px; margin-left:auto; margin-right:auto; margin-bottom:2rem; } @media (min-width: 576px) { #news-header { width: 100%; } } @media (min-width: 768px) { #news-header { height: 325px; } #news-header h1 { font-size: 2rem; } #news-header h2 { font-size: 2rem; } } @media (min-width: 992px) { #news-header { height: 350px; } #news-header h1 { font-size: 3rem; } #news-header h2 { font-size: 2rem; } } @media (min-width: 1921px) { #news-header { height: 400px; } #news-header h1 { font-size: 3.5rem; } #news-header h2 { font-size: 2.5rem; } }
Scientists Map Earth’s Most Remote Regions
Satellites transform Earth’s polar regions from the most poorly mapped places on the planet to the best-mapped places on the planet.
September 4, 2018
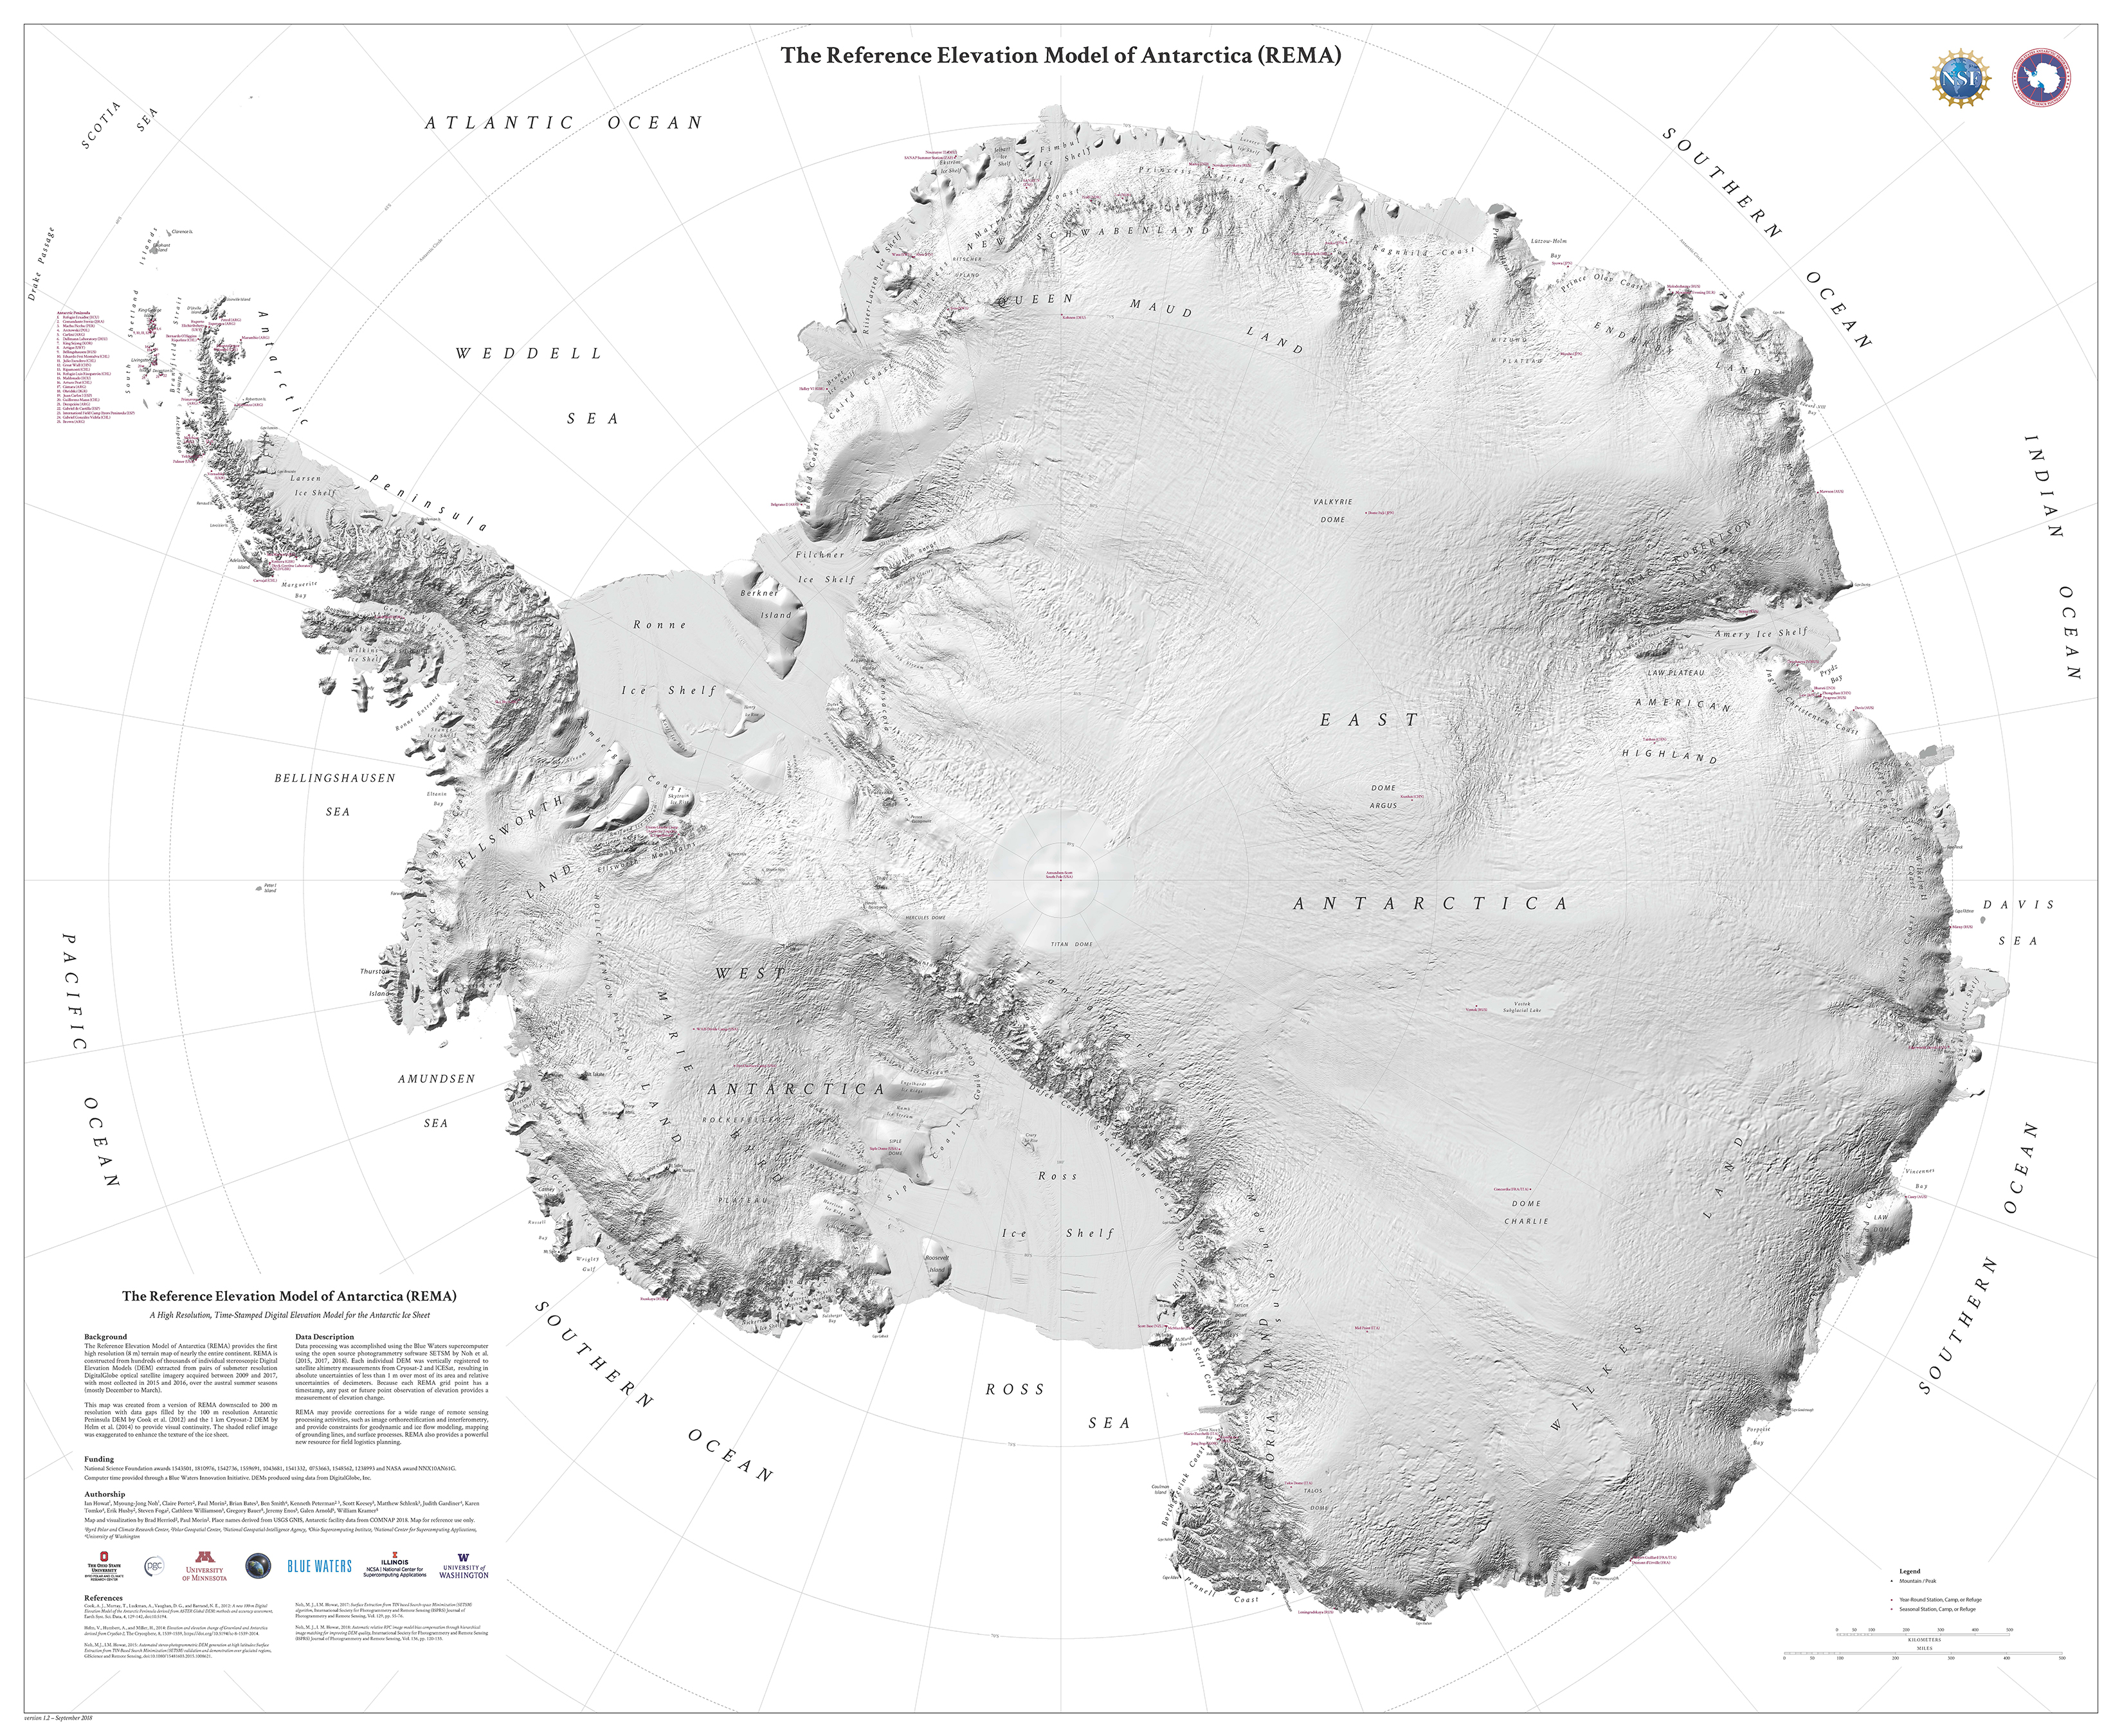
This week, researchers released the first high-resolution, high-accuracy terrain map of Antarctica. The Reference Elevation Model of Antarctica (REMA) project, led by researchers at The Ohio State University’s Byrd Polar and Climate Research Center (Byrd Center), opens new possibilities for understanding Earth processes and monitoring change in polar regions.
Using software developed at the Byrd Center, high-performance supercomputers, and a constellation of polar-orbiting satellites, REMA gives a precise measurement of surface elevation, providing detailed information about the structure of the surface, its roughness, and how it is changing through time.
The first high-resolution, high-accuracy terrain map of Antarctica, was constructed with data extracted from satellite imagery.
“The Earth’s land surface topography is a fundamental data set for geosciences, geographical sciences, and civil engineering, essential to disciplines ranging from hydrology and urban planning to plate tectonics,” said Ian Howat, the project leader of REMA and Director of the Byrd Center.
Despite the importance of generating detailed surface maps, Antarctica has remained one of the most poorly mapped regions on Earth. The region's extreme temperatures, snow-covered glaciers, crevasses, cliffs, and ice sheets, make generating topographic information challenging.
“Up until now, we’ve had a better map of Mars than we’ve had of the Earth,” said Howat.
To overcome these challenges the project team developed new technology to collect extremely accurate data sets with satellites. The technological advances behind REMA will permit a focus on future scientific exploration of one of Earth’s most remote regions.
While the Byrd Center’s Ian Howat and M.J. Noh developed software that automated the assembly of overlapping pairs of high-resolution satellite images, the project’s success depended on collaborators at the Polar Geospatial Center at the University of Minnesota. The images are processed using computer resources provided through an Innovation Allocation on the Blue Waters supercomputer located at the National Center for Supercomputing Applications at the University of Illinois at Urbana-Champaign.
Support for REMA was provided by the National Geospatial-Intelligence Agency and the National Science Foundation. REMA and the ArcticDEM, a complementary project for the Arctic, are available online at https://www.pgc.umn.edu/data/rema and https://www.pgc.umn.edu/guides/arcticdem/introduction-to-arcticdem/ respectively.
Comparison between prior available surface imaging (left) and REMA (right) shows dramatically improved detail.
Download a full-size Reference Elevation Model of Antarctica poster.
Esri has developed an online web mapping application to explore REMA data. The REMA Hillshade Viewer allows maps to be made, distances to be measured and images to be exported. The shaded relief is optimized to enhance the texture of the ice.