Spatiotemporal scaling of avian diversity change

National Science Foundation: Environmental Biology Award
Principal Investigator, Marta Jarzyna
PROJECT ABSTRACT

Marta Jarzyna
Biodiversity -- the variety of all forms of life, from genes to species, to ecosystems -- serves many functions to humans and its loss is one of the most pressing environmental issues of our time. Evidence of biodiversity change, however, remains limited and inconsistent. This impedes predictions for the consequences of change to future ecosystems and human well-being, and further hinders conservation actions. Contradictory reports on the state of biodiversity result largely from a failure to recognize that biodiversity change is complex and takes place across many different scales. For example, if measured at local sites, biodiversity might show no change through time because new species can enter a region as others leave or go locally extinct. Declines at the global scale are expected because global extinctions cannot be offset by colonizations. Furthermore, the metrics by which biodiversity is defined and measured can affect conclusions regarding its change. For example, even if species counts remain constant at a given site -- giving the impression of no net change -- the diversity of functions and traits (such as, diet type) might decline if species leaving the site provided particularly unique ecological functions. To address disparities in evidence for biodiversity change, the researchers will evaluate massive databases of bird diversity collected across multiple spatial and temporal scales in North America. The project also will quantify the role that climate change has played in biodiversity change at each of the scales. Results from the project can be used to assist resource management in decision-making and to inform conservation missions. The project will provide opportunities for broadening participation in science by involving undergraduate students and postdoctoral researchers from groups typically underrepresented in STEM.
The project will leverage data collected at different spatial and temporal scales from a number of sources: The National Ecological Observatory Network, eBird, Breeding Bird Survey, and Christmas Bird Count. State-of-the-art modeling techniques will be used to integrate these different types of data and develop dynamic species' abundance distributions at spatial resolutions from local to continental, and temporal intervals from a week to a decade. By stacking species' abundance distributions together, dynamic estimates of taxonomic, functional and trait, and phylogenetic diversity will be collected. The project will quantify change in those biodiversity facets over the course of 50 years and use novel cross-scale modeling techniques to determine the spatial and temporal scale dependence of that change as well as the effects of climate change. By providing the first empirical assessment of spatiotemporal scaling of multi-faceted bird diversity change of the North American avifauna, these efforts will help resolve ongoing debates about the magnitude of biodiversity change.

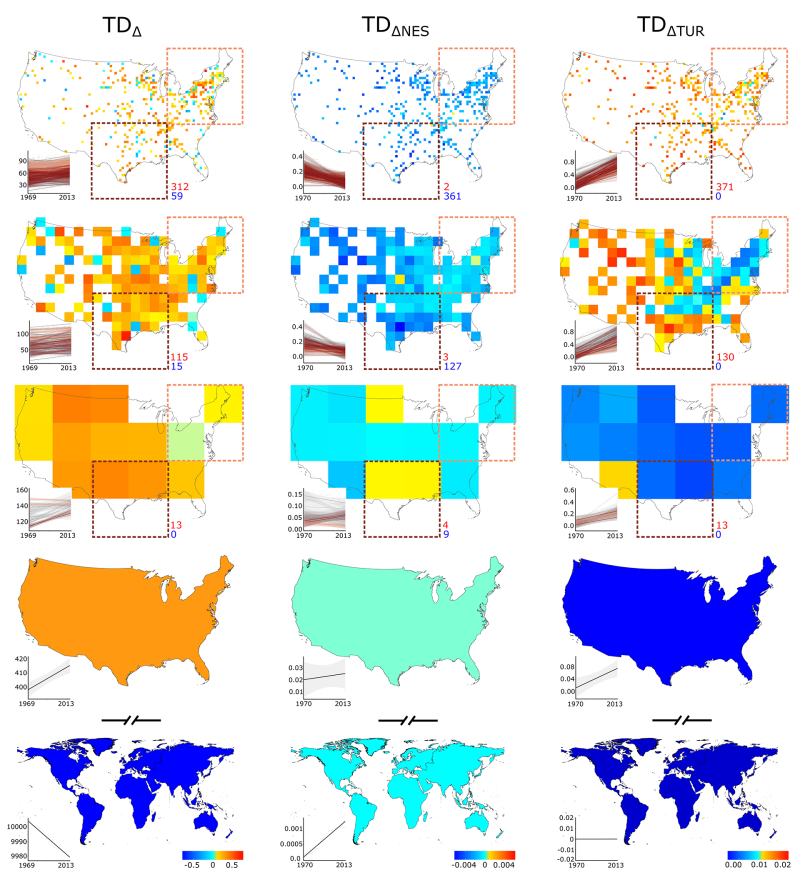
Fig 1. Spatial variation in avian diversity change across different spatial scales. The scales shown, from top to bottom, are 50 km, 200 km, 800 km, the continental United States, and the globe. Fitted positive and negative slopes (see main text) indicate increases and declines in taxonomic diversity (TDΔ, left panel), temporal nestedness of taxonomic diversity (TDΔNES, middle panel), and temporal turnover of taxonomic diversity (TDΔTUR, right panel). Red and blue numbers indicate the number of grid cells for which these trends were positive and negative, respectively. Insets show the fitted slopes between the respective measure of change (y-axis) and time (x-axis; calendar year) for the cell inside the brown (brown lines) or beige (beige lines) quadratic regions.

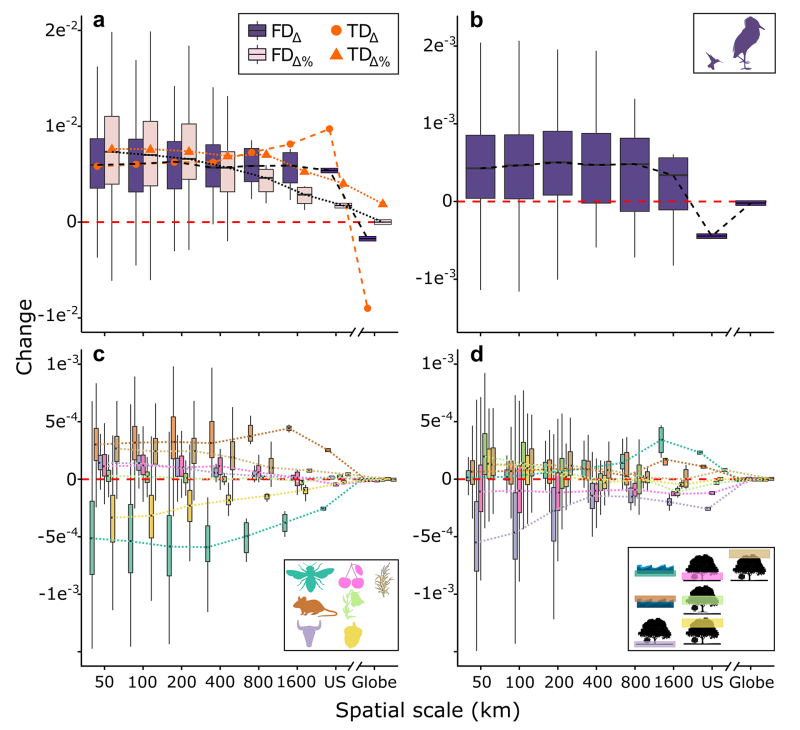
Fig 2. Scale dependence of changes in avian functional diversity and functional trait space. Changes were calculated as the fitted slopes between time and (a) functional diversity (FDΔ) and relative change in functional diversity (FDΔ%), (b) assemblage mean body mass, (c) proportions of different diets, and (d) proportions of different foraging niches. Diet and foraging niche categories consisted of seven axes each: proportions of invertebrates, vertebrates, carrion, fresh fruits, nectar and pollen, seeds, and other plant materials in species’ diet (diet category), proportional use of water below surface, water around surface, terrestrial ground level, understory, mid canopy, upper canopy, and aerial (foraging niche category). To facilitate the visual comparison, FDΔ was standardized to fit the scale of the other measures.
