Time Series of Precipitation Datasets and Modeled Trends In Early Summer Season
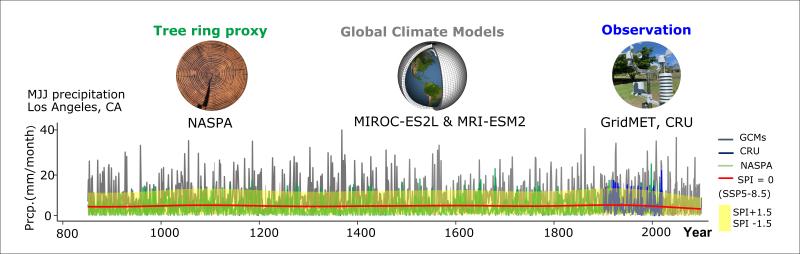
This figure shows the time series of 3-months average precipitation of 5 different datasets and modeled trends at mean(red line), pluvials and drought extremes (SPI = 1.5 and -1.5) in early summer season(May, June, July). Datasets used in this study are NASPA(Tree-ring reconstruction), GridMet and CRU(Gridded observation), and MIROC and MRI-ESM2 (Global Climate Models).
The figure captures notable drying trends in early summer in modern Industrial era (20th century) and future(21st century) compared to the last millennium of pre-Industrial period(850-1900 CE). The decreasing trends are shown in all mean, both extremes, implying less precipitation all conditions, particularly the wet years (upper boundary of shaded line) show abrupt drying trends in Modern Industrial period.