Virtual Lesson
Plot of Ice Core Data
Background Information on Ice Cores
Ice cores provide scientists with a way to learn about environmental conditions in the past before people were around to write records. Snow falls on a glacier each year creating a new layer of snow. As time passes more layers are created, one each year. This results in a “layer cake” of snow. The weight of the snow at the top of the glacier starts to compress the snow below. This ultimately results in a “layer cake” of ice.
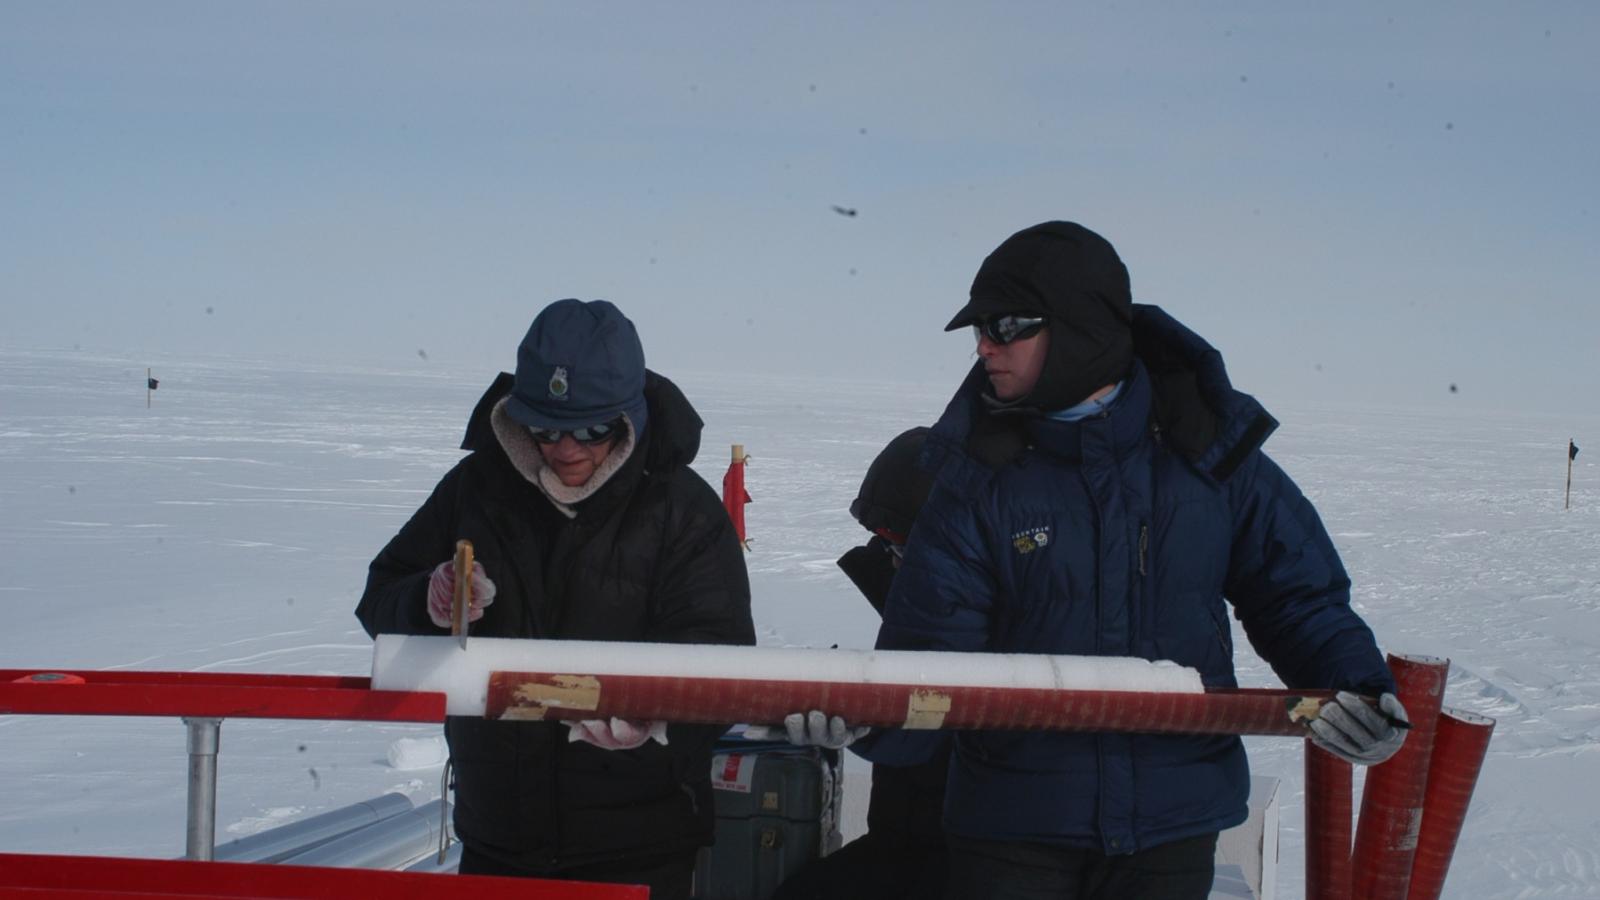
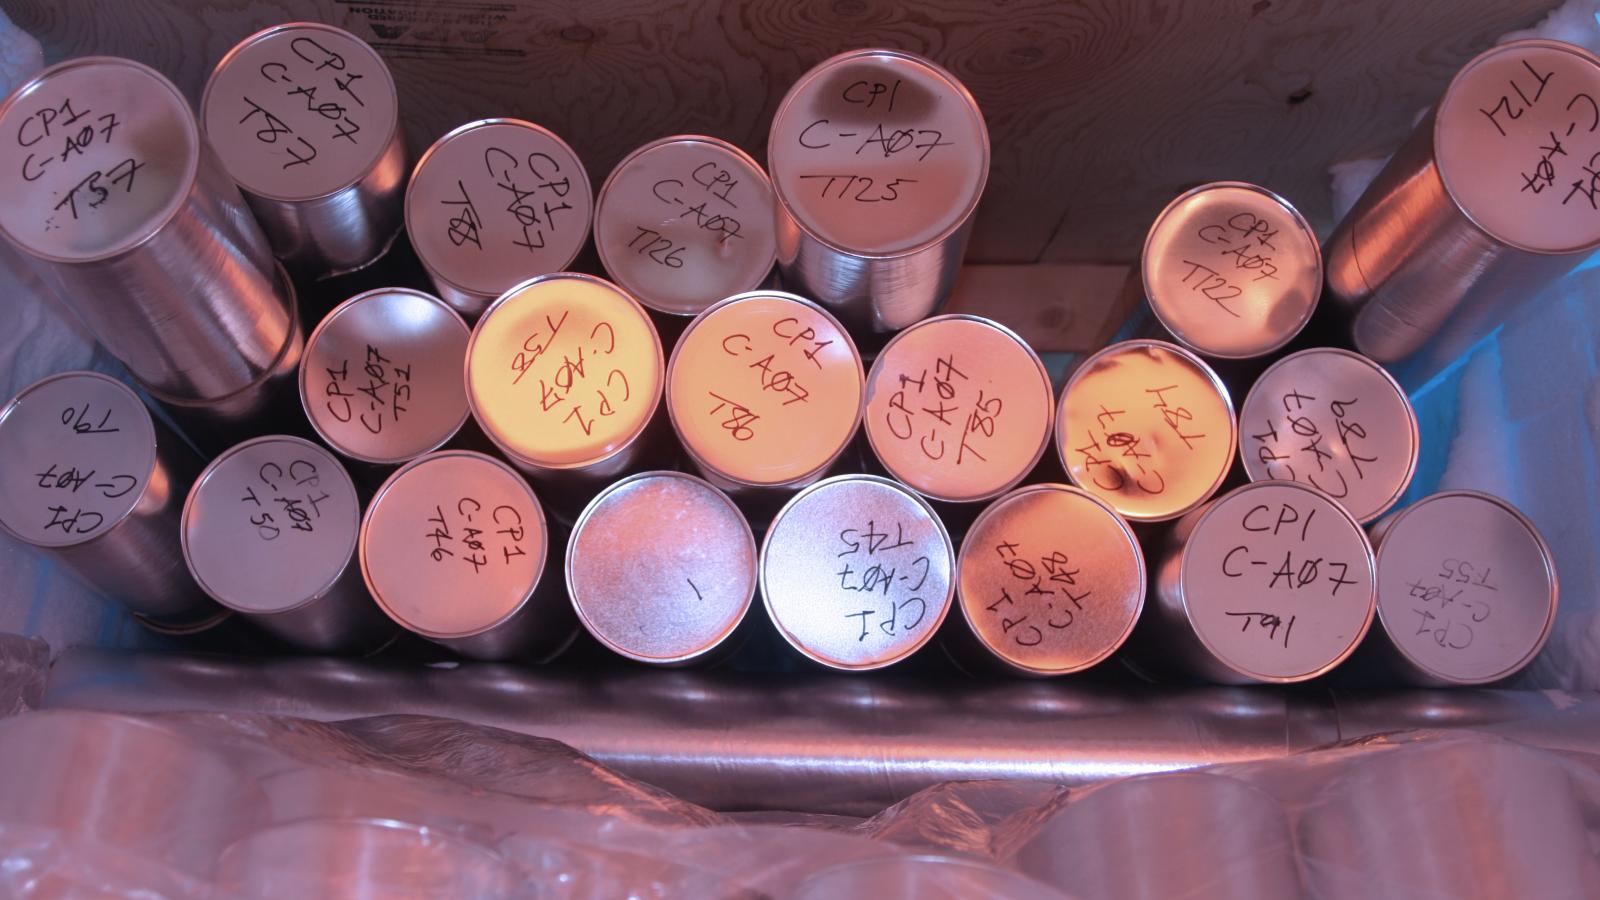
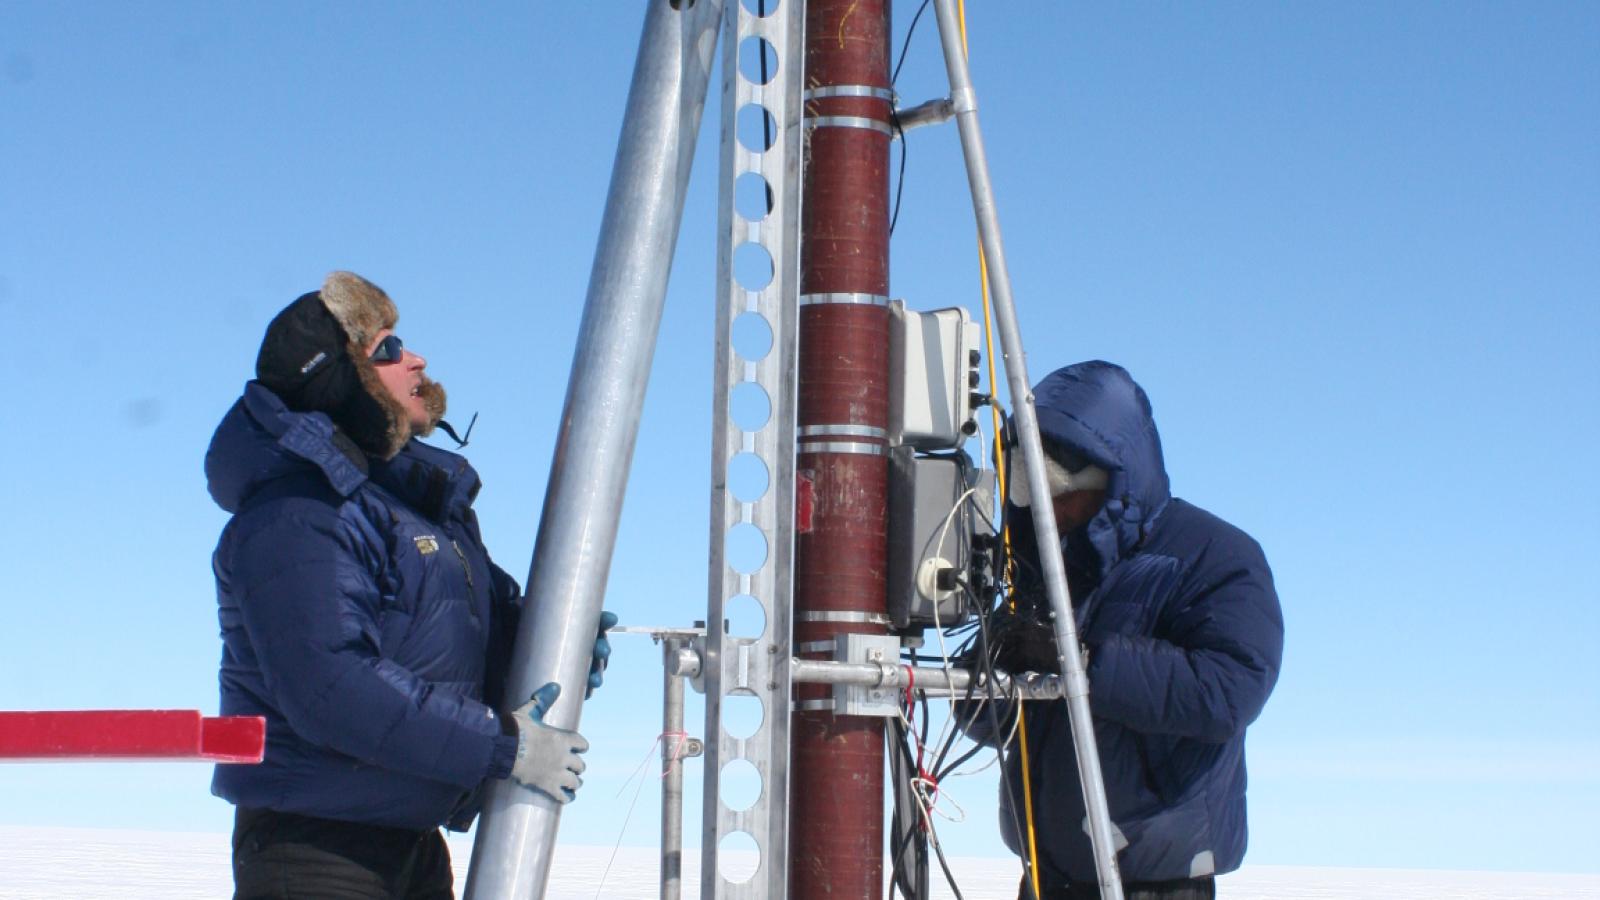
Scientists can see the layers where the glacier breaks open at places called crevasses, but using hollow drills, they can drill ice cores at other locations that allow them to see more layers. The benefit of drilling ice cores is that the core can be taken back to the laboratory to analyze and, since a new layer is created each year, the more layers that scientists can observe the more years into the past they can investigate.
The layers of ice provide information about the amount of snow that the glacier received in a given year. A thicker layer means that the glacier received more snow; a thinner layer means that the glacier received less snow. The layer of ice also contains materials such as debris from forest fires and volcanoes and living materials such as pollen and insects. Many of these materials can be seen with the naked eye.
Other materials cannot be seen or measured with the naked eye. More sophisticated techniques are used to analyze the amounts of these materials. A few examples include oxygen isotope ratios, dust concentrations, and sulfate concentrations. Oxygen isotope ratios, the ratio between oxygen-16 and oxygen-18, provide us with information about the temperature when the snow fell. Generally, a greater amount of oxygen-18 means a warmer atmosphere and a lesser concentration of oxygen-18 means a colder environment.* You will often hear this ratio being used to discuss temperatures because it estimates the temperature indirectly. Dust concentrations provide information about how dry the atmosphere was upwind of the glacier. Sulfate is emitted by volcanic eruptions and combustion of fuels high in sulfur.
Scientists can use different clues in the ice to determine the exact year a particular layer was created. Knowing the age of one layer and keeping in mind that deeper layers are older than shallow layers, scientists can determine a timeline of environmental conditions for the past. The annual layers of ice can be separated from one another using oxygen-18 and/or dust. For oxygen-18, annual minima represent the coldest time of the year, the winter season for the Polar Regions. For dust, annual maxima represent the driest time of the year, typically the spring season in the Polar Regions.
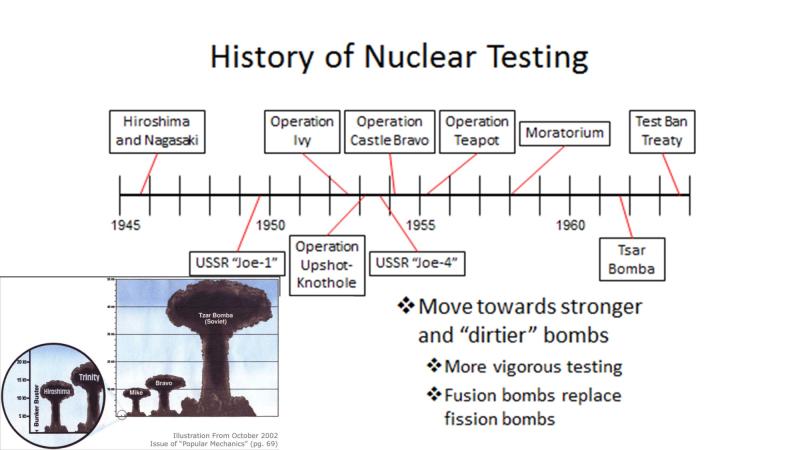
Seasonally varying oxygen isotope ratios and dust concentrations allow scientists to mark and count annual layers of ice throughout the core. However, simply counting layers can introduce some uncertainty as to the exact age of the ice layer, and scientists often like to use several methods to check their count. Fortunately, certain historical events allow for a second method. Scientists can look for spikes in sulfates from volcanic eruptions that occurred in known years or measuring beta-radioactivity from nuclear weapons testing following World War II. From the late 1940s to the early 1960s, nuclear weapons became stronger and “dirtier,” releasing larger amounts of radioactive material into the atmosphere. Above-ground weapons testing ended in 1963 due to the Test Ban Treaty.
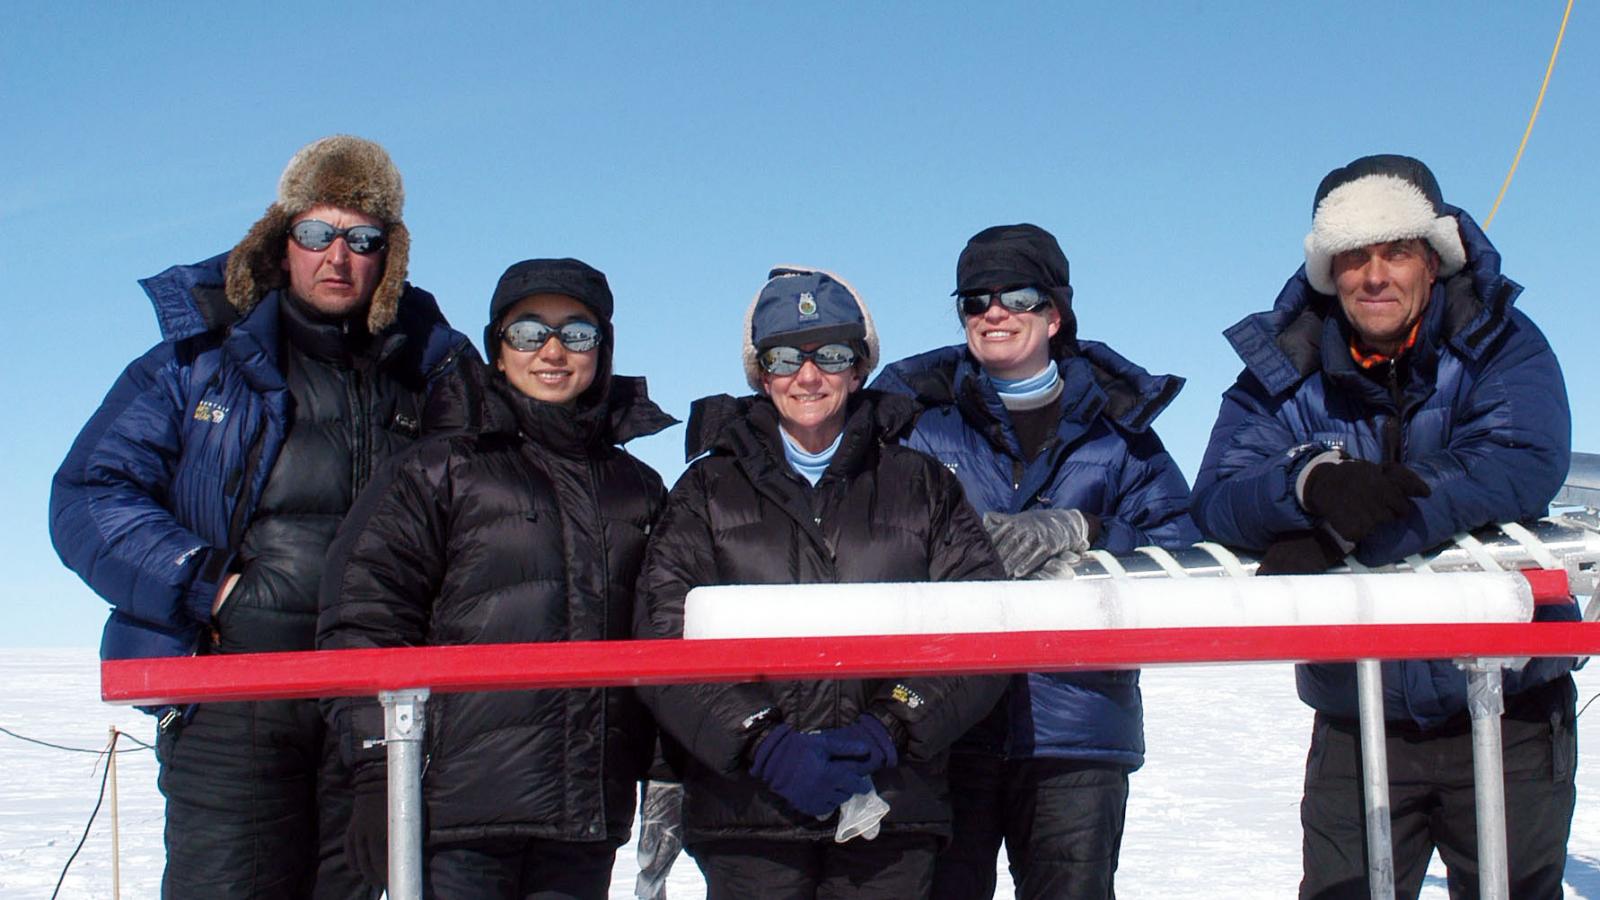
The data that you are about to analyze come from a core that was drilled in West Central Greenland.
*This is due to differential evaporation rates, known as fractionation, of oxygen-18 dependent upon the ambient temperature.)
Nuclear Weapons Testing Background Information
Slides and Presentation
Presentation slides are available in PowerPoint (the link will download a PowerPoint document) and PDF (the link will open a
PDF document) formats.
Virtual Reality Tour of an Ice Core Drilling Expedition
While the data and background information for this virtual lesson is for Western Greenland, you can participate in an ice core drilling campaign with the Byrd Center on a summit in Peru.

