Effects of Interactive Data Visualizations on Student Engagement and Perceived Learning
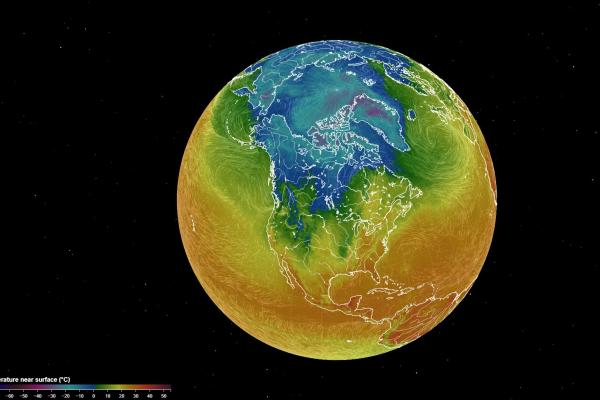
A team at the Byrd Center collaborated with a group of other scientists on a study of the effects of interactive data visualization on student engagement and perceived learning in formal educational settings. The scientists used Fluid Earth (FE), an interactive web visualization tool depicting evolving weather and climate patterns. By assigning one group of middle school students to the FE website and another group to a pre-recorded video of FE, the scientists observed greater engagement among the former students. Although further study is needed to evaluate the effects of content knowledge learning in a diverse student population, preliminary evidence suggests that interactivity is an essential component of science education visualizations. Students benefit from exploring geosciences processes and concepts through interactive visualization.
The study titled Interactive data visualizations of Earth's atmosphere: Effects on student engagement and perceived learning was published earlier this year in the Journal of Geoscience Education. The scientist involved in the study were Jason Cervenec, principal investigator and education and outreach director at the Byrd Center, Jesse Fox, associate professor at Ohio State's School of Communications, Karina Peggau, Byrd Center education and outreach program coordinator, Aaron B. Wilson, State Climatologist of Ohio, assistant professor, Ag Weather and Climate Field Specialist and principal investigator at the Byrd Center, Bingyu Li, Expedia Group, Dingyu Hu, San Jose State University, Ruiyang Chang, Joey Wong & Craig Bossley.