
News
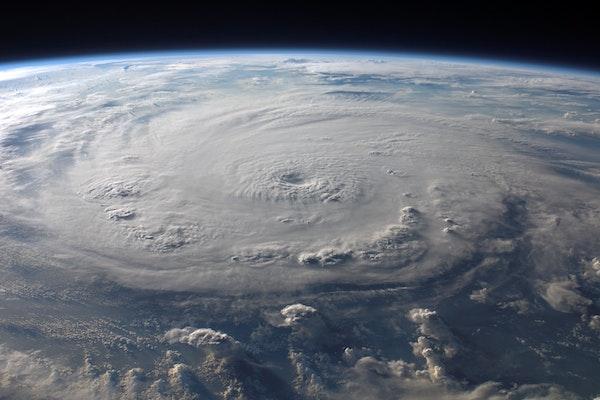
Detecting Extreme Climate Event Impacts Using Remote Sensing Data in Deep Machine Learning Paradigms
C.K. Shum, Distinguished University Scholar and Professor in the School of Earth Sciences (SES) at The Ohio State University and a Principal Investigator at the Byrd Center, co-…
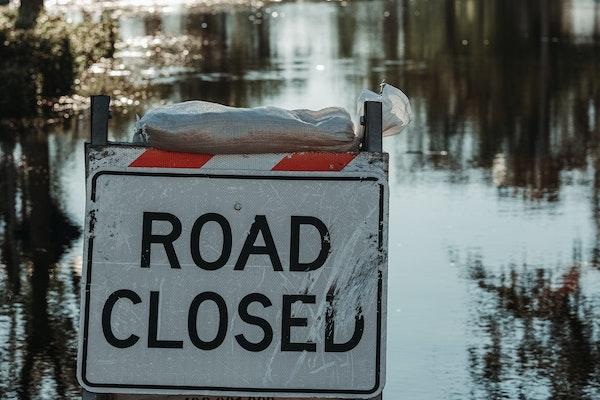
Ongoing and Future Projected Intensification of Wet and Dry Extremes in North America
Kyungmin (Kay) Sung, a postdoctoral scholar at Stagge Hydrology Lab at The Ohio State University is the lead author of a study titled…
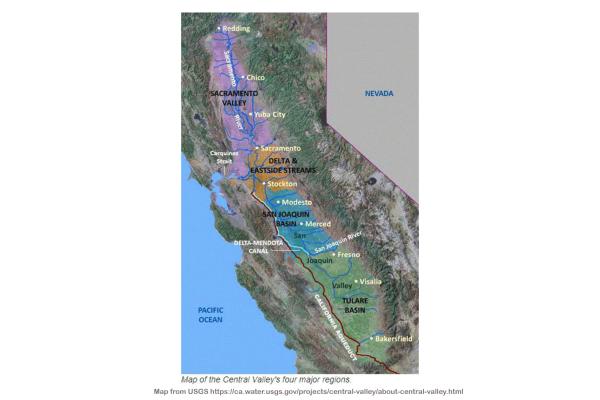
Using Satellite Altimetry Data to Monitor Groundwater Depletion Through Land Subsidence in California's Central Valley
Xuechen Yang, a graduate student in The School of Earth Sciences (SES) at The Ohio State University, is the lead author of a study using satellite altimetry data from California's…
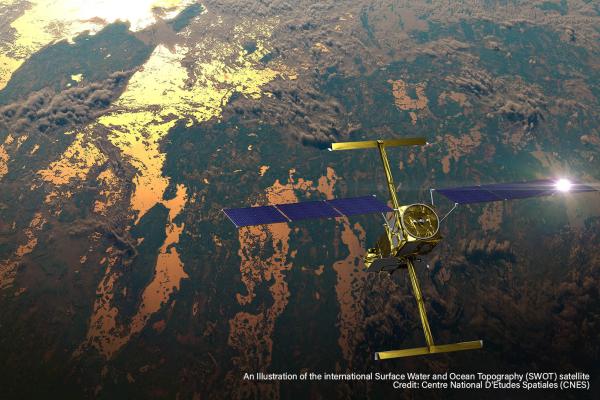
The Surface Water and Ocean Topography Satellite to Collect Data on Over 90% of the Water on Earth's Surface
On December 16, 2022, a SpaceX Falcon 9 rocket was launched into space from Vandenberg Space Force Base in California, carrying with it the Surface Water and Ocean Topography (SWOT)…
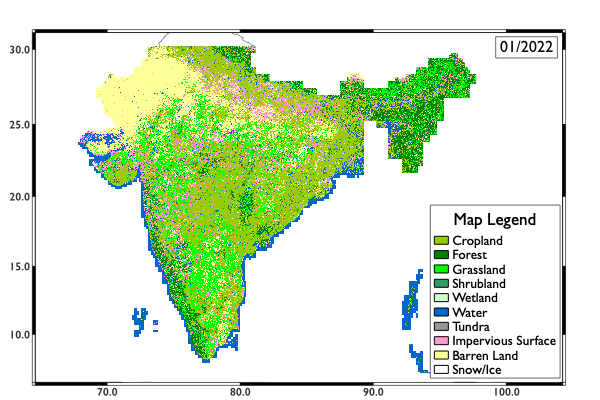
Improving Forest Sustainability in Pan-India
Last month, Ying Zuo, a graduate student in the School of Earth Sciences (SES) at The Ohio State University, presented a research poster at the American…
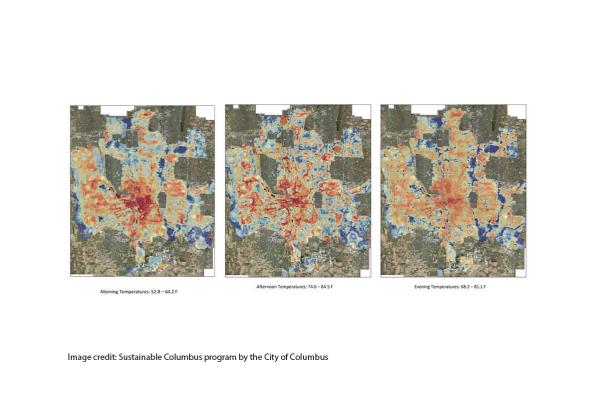
The City of Columbus Releases Results of its Urban Heat Mapping
This past summer, Geddy Davis, program coordinator, weather and climate services, and Karina Peggau, education and outreach program coordinator at the Byrd Polar and…

Ohio State's Carbon Emissions Have Dropped by 30% Since 2015
Ohio State News recently reported on The Ohio State University's efforts and progress toward reducing its carbon footprint stemming from sustainability goals set in 2015. To date, the…

Reflections and Future Strategies for Third Pole Environment
An article titled Reflections and future strategies for Third Pole Environment was published online recently by Nature Reviews Earth & Environment. The authors included Third Pole…
Protist Impacts on Marine Cyanovirocell Metabolism
A study was recently published online in the journal ISME Communications titled Protist impacts on marine cyanovirocell metabolism, shedding light on how some carbon cycling…